
Impact Assessment
Impact Assessment

In 2020, the London School of Economics & Political Science (LSE) India Observatory conducted a case study on the impact of Yuvau2019s programs on the grassroots.
Student Outcomes
– Imrovement in learning outcomes in Math, Science and other subjects by 4 times
– Improvement in overall attendance by 15%
Enrolment Outcomes
– 4.4% increase in student enrolment
Attendance Outcomes
– 3.5% increase in attendance outcomes across all grades
– 14% increase in attendance in schools with WASH interventions
– 16% increase in attendance in schools with WASH and Smart Classroom interventions
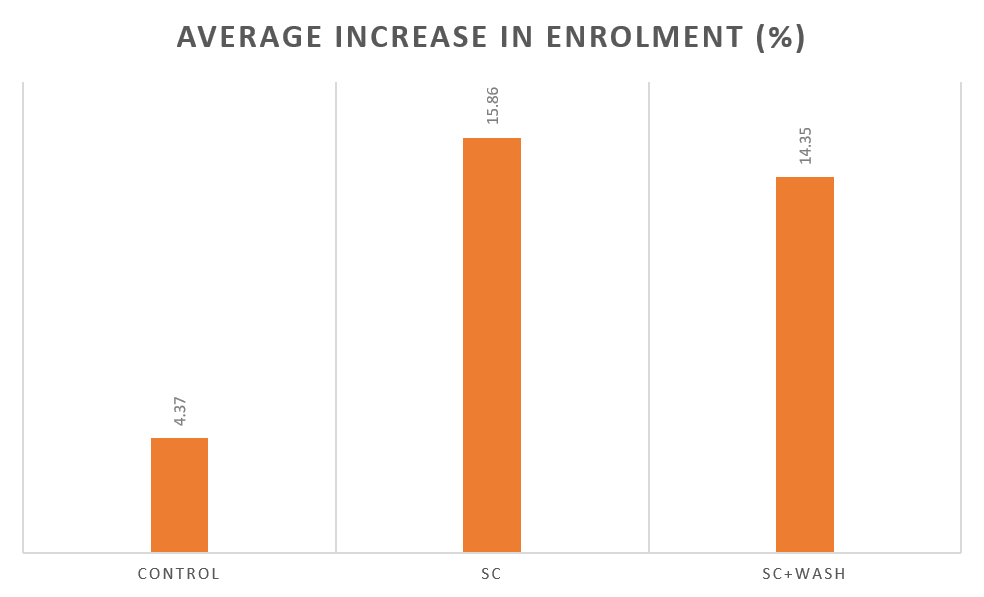
Student Enrolment
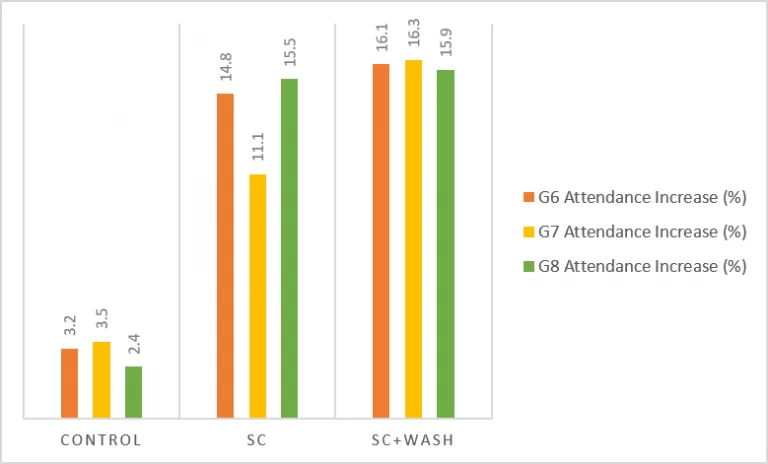
Student Attendance
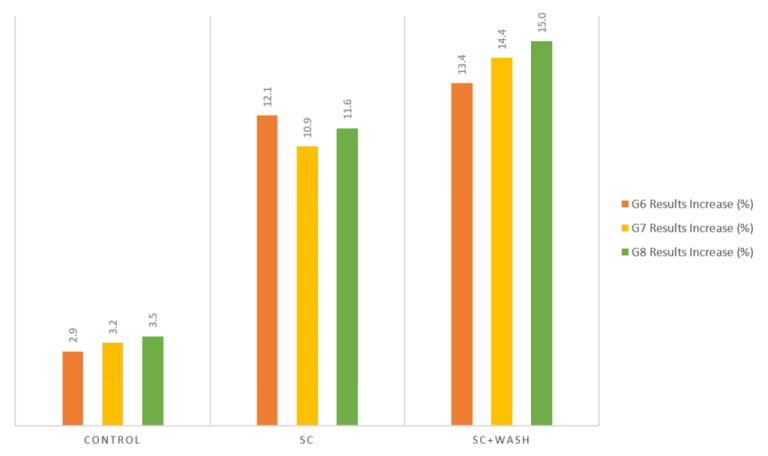
Student Learning Outcomes
Outcome: Test Results and State-Wise Differences
The availability of data across four states presents an opportunity to visualise how the impact is different in each of the four states. Gujarat, Madhya Pradesh, Maharashtra and Tamil Nadu are four states with different development levels, demographics and economies. The impact that Yuvau2019s interventions have in the four states is also different. For instance, the increase in enrolment and attendance in the schools in Tamil Nadu is the lowest amongst all four states. This could possibly be because Tamil Nadu is a high performer in the education sector and already has high levels of enrolment. On the other hand, the increase in the scores is highest in Gujarat. This could be due to the increased expertise of the local teams in Gujarat, which is the home state for YU.
Teacher Outcomes
1. The implementation of the Smart Classroom has a positive effect on the teachers engaged in the programme.
2. The process of training, adaptation and engagement with Yuva and the equipment provides additional skills for teachers.
3.To examine teacher outcomes, we use a theoretical framework proposed by Coe et al (2014) for the ingredients for u201cgreatu201d teaching
4.Using qualitative feedback from the operational team at Yuva Unstoppable, we operationalise the framework to offer insights into how the smart classroom impacts teaching.
Outcomes: Inclusion
YU operates primarily in inner-city government or government-aided schools that serve students from diverse lower socio-economic strata. Often, these schools cater to children whose parents are working in lower income-paid essential services. To get insights into the nature of the demography that these schools assist, the YU operations team labelled each of the schools in our sample with the demographics of the parents of the students in the school. Approximately 28 percent of the schools in the sample catered to children of labour workers. Farmers, masons, auto-drivers were also large groups, ranging from 7 to 9 percent of the schools. These are depicted in the wordcloud here. YU provides access to quality education to children in these inner-city schools and contributes greatly to inclusion and towards achieving SDG4.
Outcomes: Qualitative
The quantitative data shows a clear increase in all the indicators that we have measured. We look at the qualitative observations made by YUu2019s organisational team to understand the nature of the improvement that has occurred through the smart classroom. They make the following 8 observations about how the programme has helped teachers and students: Impact on teachers: Improved lesson delivery, through the aid of technologies. Improved attentiveness amongst kids: Using interactive multimedia makes the students more interactive. Familiarization with new tools: Exposure to new technologies help the teachers to build technological capacity. Impact on students: With the help of interactive tools, the students are able to grasp at a faster pace leading to improved learning levels. Teachers can teach through digital documents which can be shared directly with the students, eliminating the need for taking notes. Better understanding of difficult concepts: Students are able understand the difficult concepts much easily because of the multimedia content. The use of web & smart class, any topic can be explained in an engaging manner. Improved attendance in schools: Multimedia has created an interest in the students, and they therefore enjoy coming to school now.
Input
Outcomenn
M&E Mechanism
Building new / renovating sanitation (toilet facilities)
Improvement in condition of sanitation (toilet) facilities
Monthly visit to schools by Yuva supervisor, submitting M&E forms, troubleshooting, tracking progress through infrastructure photos
Building new / renovating drinking water facilities
Improvement in access to quality drinking water
Monthly visit to schools by Yuva supervisor, submitting M&E forms, troubleshooting, tracking progress through infrastructure photos
Building digital classrooms
Effective usage of digital classrooms
Monthly visit to schools by Yuva supervisor, submitting M&E forms, troubleshooting, tracking progress through infrastructure photos, monitoring monthly usage of digital classrooms & student attendance / absenteeism
Behaviour Change Communication (BCC) Sessions
WASH related awareness in schools & communities
Quarterly visit to schools by Yuva supervisor, tracking progress through photos, session numbers & attendance
Post project handover assistance
Community Development
Quarterly meetings with School Management Committees (SMCs) and community members